April 13, 2017 - by Synoptek
Today, businesses need to be one step ahead, and they face uncertainty and instability if they don’t forecast the future with accessible data. According to a Gartner report, by 2017, 60 percent of big data projects will fail to go beyond piloting—and experimentation will be abandoned. To avoid such circumstances, enterprises have started using predictive analytics tools to forecast demand by analyzing their historical performance, along with other complex factors, and plan a better strategy.
What is R Script?
R is a powerful programming language used by statisticians, data scientists, and researchers for data mining and data analysis. It is an advanced analytical tool to develop intelligent applications and for realizing value in predictive analytics. R can be easily integrated into analytic applications to gain accurate results.
Why R to Forecast?
- R is free and accessible on practically every operating system. It is a brilliant tool for forecasting and for all statistical analysis.
- R has broad facilities for analyzing time series data. R has a few extraordinary packages that are made particularly to handle time series data.
- R is proven to be great for the creation of a period arrangement, regular deterioration, displaying with exponential and ARIMA models, and forecasting with the forecast package.

Why Integrate R with Power BI?
Regardless of R’s popularity, adoption of R alone involves a few limitations. The user interface of R does not have a modern graphical user interface, so users face difficulty in producing publish-ready outputs; it consumes available memory quickly. The major drawback of these limitations is that R is not very powerful in data visualization, and in sharing work or collaborating within the organization. In order to overcome these limitations, Power BI introduced R scripting in its environment. Power BI very well complements R and the tight integration between both can help develop great content using R and Power BI visualization capabilities.
Benefits of R-Based Data Maps in Power BI
There is an endless number of advantages and benefits that come with integrating R with Power BI.
With a huge number of users and ready-to-use R packages, the R language adds incredible extensibility to Power BI, with unending abilities for analyzing and visualizing data. The new rich R visuals are fully integrated with Power BI service reports and users will be able to filter, cross filter, and pin it to the dashboards. Therefore, Power BI users can view R visuals without necessarily being aware of this underlying technology.
The data uploaded to the Power BI service can be configured with a scheduled refresh, which triggers periodic execution of R script in its original environment and refreshes the data every time changes are made. With the scheduled refresh, the data displayed will always be up to date.
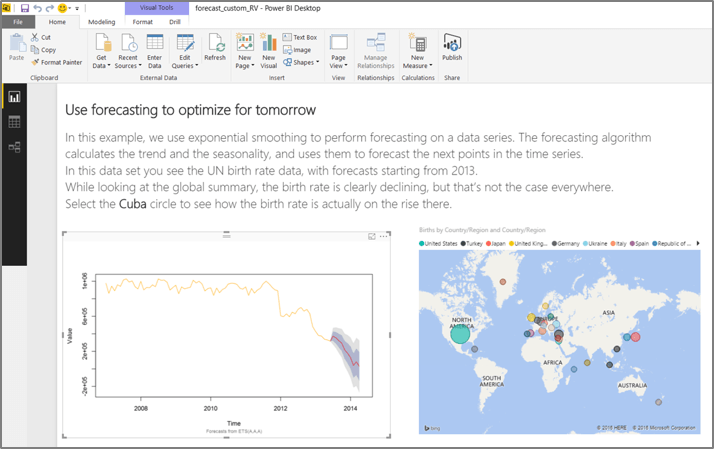
These examples should illustrate how with just a few lines of R script, you can create a simple and easy, yet astonishing, interactive forecasting tool in Power BI.
R Integration with Power BI – An Interactive Forecasting Tool
The Power BI and R integration makes it simple for users to make great visualizations to gain insights and predictions for their business, and the results can also be shared within the organization using Power BI. The R analytics solution has the ability to scale and adapt to future technology and platform changes.
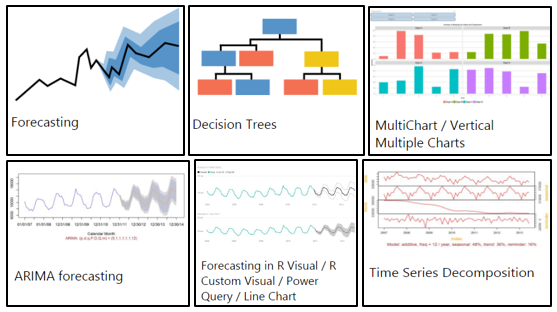
You can create R forecast visual easily with Power BI, without even understanding R as shown in the example below:
In addition to all the amazing looking visualizations you can generate with R, you can also use other forecasting, statistical, and machine learning capabilities that R is equipped with, to make meaningful future predictions.
Learn how Synoptek can help you design and develop a data management solution to match the information demands of your organization.
