December 11, 2023 · by Hiren Kapadia 4 min read
~Knowledge is knowing the right answer; intelligence is asking the right question~
Do you often find yourself submerged in a pool of data, not knowing what to do or where to begin? Is driving deep analytics for decision-making a major impediment? Do you frequently struggle to connect countless data sources and make sense of it all?
If the answer to any of these questions is a yes, Business Intelligence (BI) is what your organization needs. The right BI tool can help uncover critical insights into your business, competition, and customers and keep pace with emerging customer needs and changing market conditions. It can enable technical as well as non-technical users to model, analyze, explore, share, and manage growing volumes of data. Through intelligent and timely analysis, they can deliver automated insights at the right place, right time, and right context.
What Is Tableau?
Tableau is a versatile data visualization and business intelligence tool. It empowers users to easily connect, visualize, and share data interactively. Without any coding skills, users can analyze large datasets using a user-friendly drag-and-drop interface. Tableau offers a wide range of chart types, from line and bar charts to maps and scatter plots.
What Is Power BI?
Microsoft’s Power BI is a business analytics solution offering interactive visualizations and robust business intelligence tools. It boasts a user-friendly interface that empowers end-users to craft reports and dashboards effortlessly. Users can seamlessly connect to diverse data sources, perform data cleaning and transformation, create custom calculations, and represent data using charts, graphs, and tables.
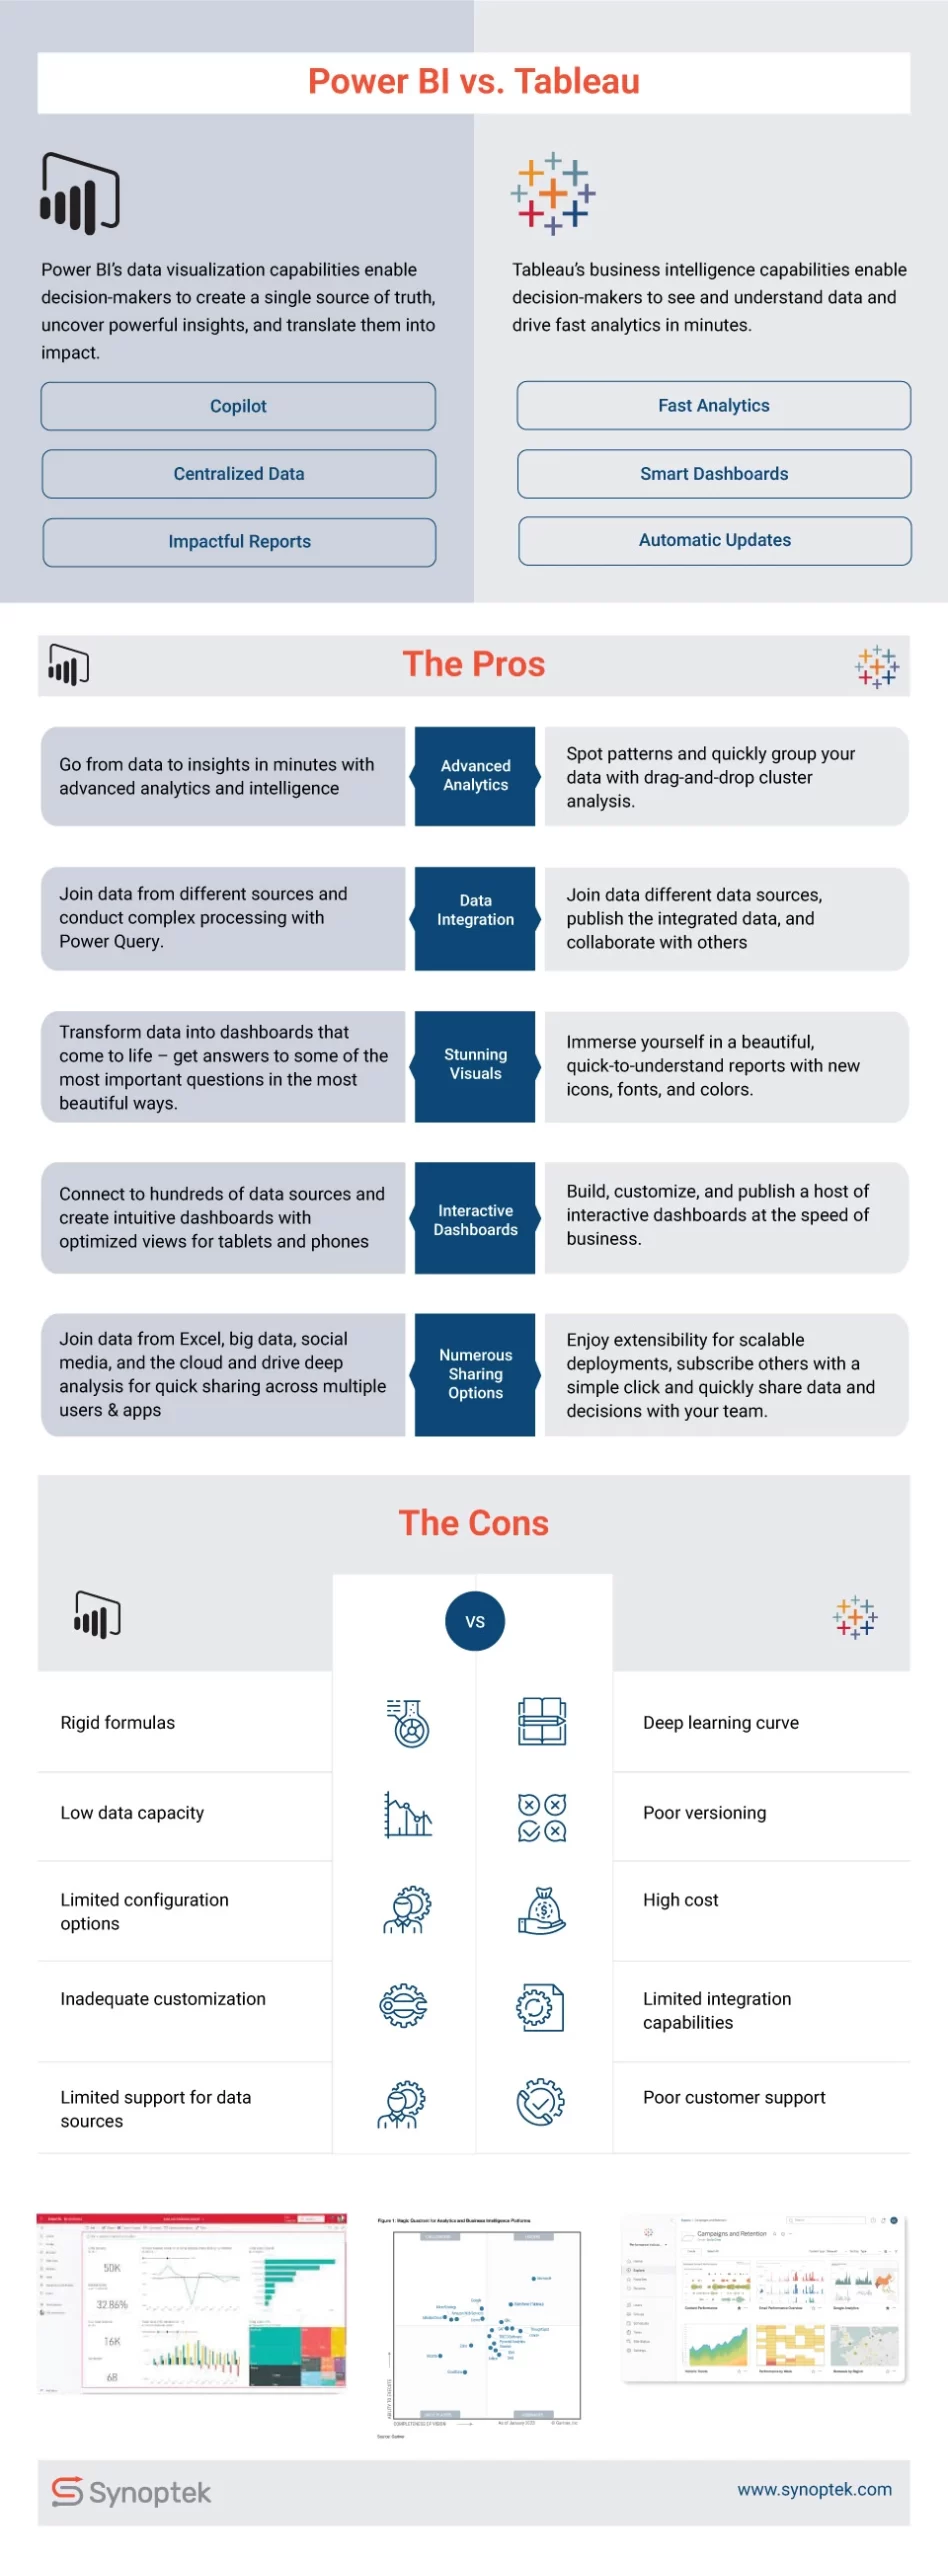
Tableau vs. Power BI: Difference and Comparison
The infographic below gives a snapshot of the two most popular BI tools – Power BI and Tableau. It showcases the similarities between the two tools, the differences, and everything in between. Read on to see what these tools have to offer and how they can enable you to turn your data into ultimate value.
Summing up
BI platforms are finding great use in businesses of all sizes. Offering a blend of modern AI and low-code/no-code capabilities, they are helping expand the vision for analytics beyond simple dashboards. Platforms like Power BI and Tableau deliver enriched contextualized insights, allowing decision-makers to take timely and accurate actions and deliver business value.
When it comes to choosing the right platform for your business, several factors come into play.
- If you need an easy-to-use BI platform that enables users to get started quickly, opt for Power BI. If you need to conduct complex processing and advanced visualization capabilities, go for Tableau.
- If you need support for many data sources, Tableau is the better bet. If you require easy embedding of reports in different environments, embrace Power BI.
- If you have a limited budget but still require a tool for seamless data management, opt for Power BI. If you need your BI tool to offer fast and reliable performance even as your data scales, choose Tableau.
The final choice depends on your organization’s data visualization needs, roadmap, and budget. So, take time to assess each solution in detail and make the right choice.

Contributor’s Bio

Hiren Kapadia is a Senior Architect of Business Intelligence at Synoptek, with two decades of extensive experience in the Software Development Life Cycle (SDLC). Throughout this journey, Hiren has been deeply involved in numerous Data Warehousing and ETL projects, utilizing a spectrum of technologies including various database platforms, MSBI, Data Factory, Pentaho, QlikView, Power BI, Tableau, and Azure cloud-based solutions. His core responsibilities encompass many pivotal tasks such as database modeling and design, metadata management, database coding, establishing data warehouses, and crafting insightful visualizations.